6 min read
An easy look at Grafana architecture
Delve into Grafana's architecture in this article, where I strive to simplify complex concepts. Explore the components that make up Grafana and gain a clear understanding of how they work together to create a seamless monitoring and visualization experience.
What is Grafana?
Grafana is an open-source platform for monitoring and observability, designed to visualize and analyze metrics, logs, and other data from various sources in real-time. It provides a flexible and intuitive interface for creating customizable dashboards, charts, and graphs, allowing users to gain insights into the performance of their systems, applications, and infrastructure.
From a technical perspective, Grafana is a web-based application written in TypeScript and Go, with a backend that interacts with various data sources and a frontend that renders visualizations for users.
Grafana architecture
Well, this doesn’t seem to be quite straightforward, but let me provide some context.
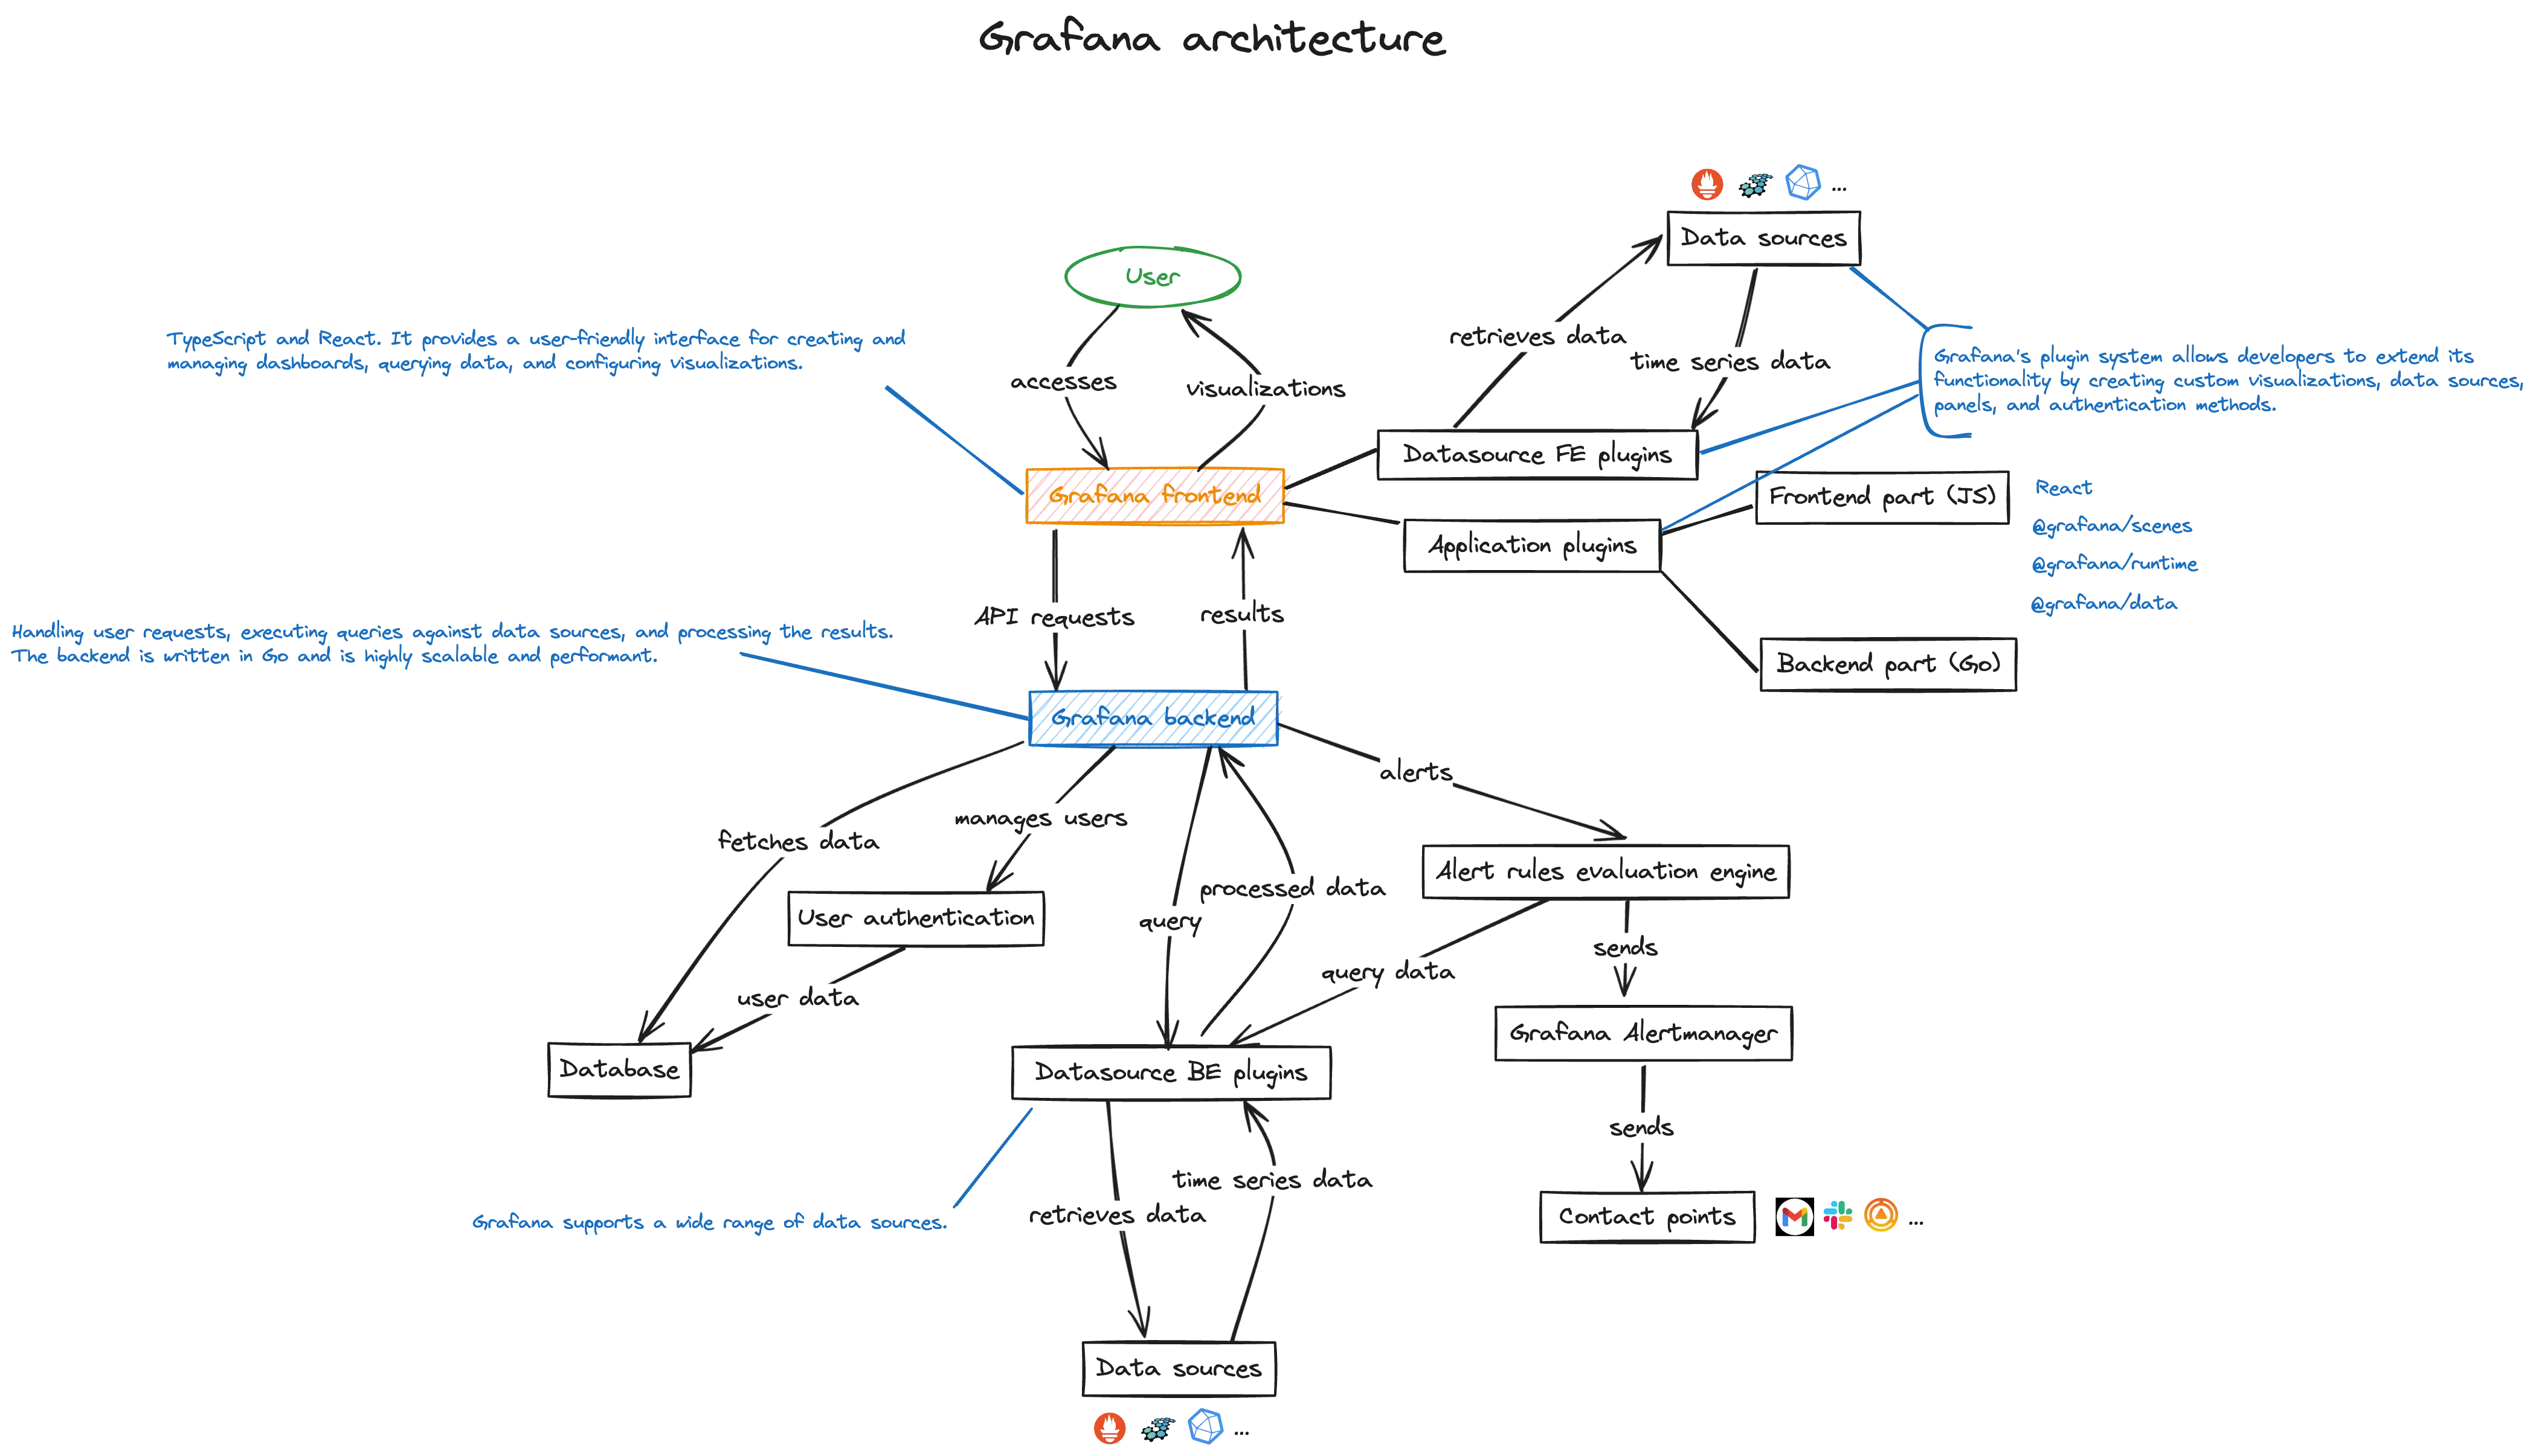
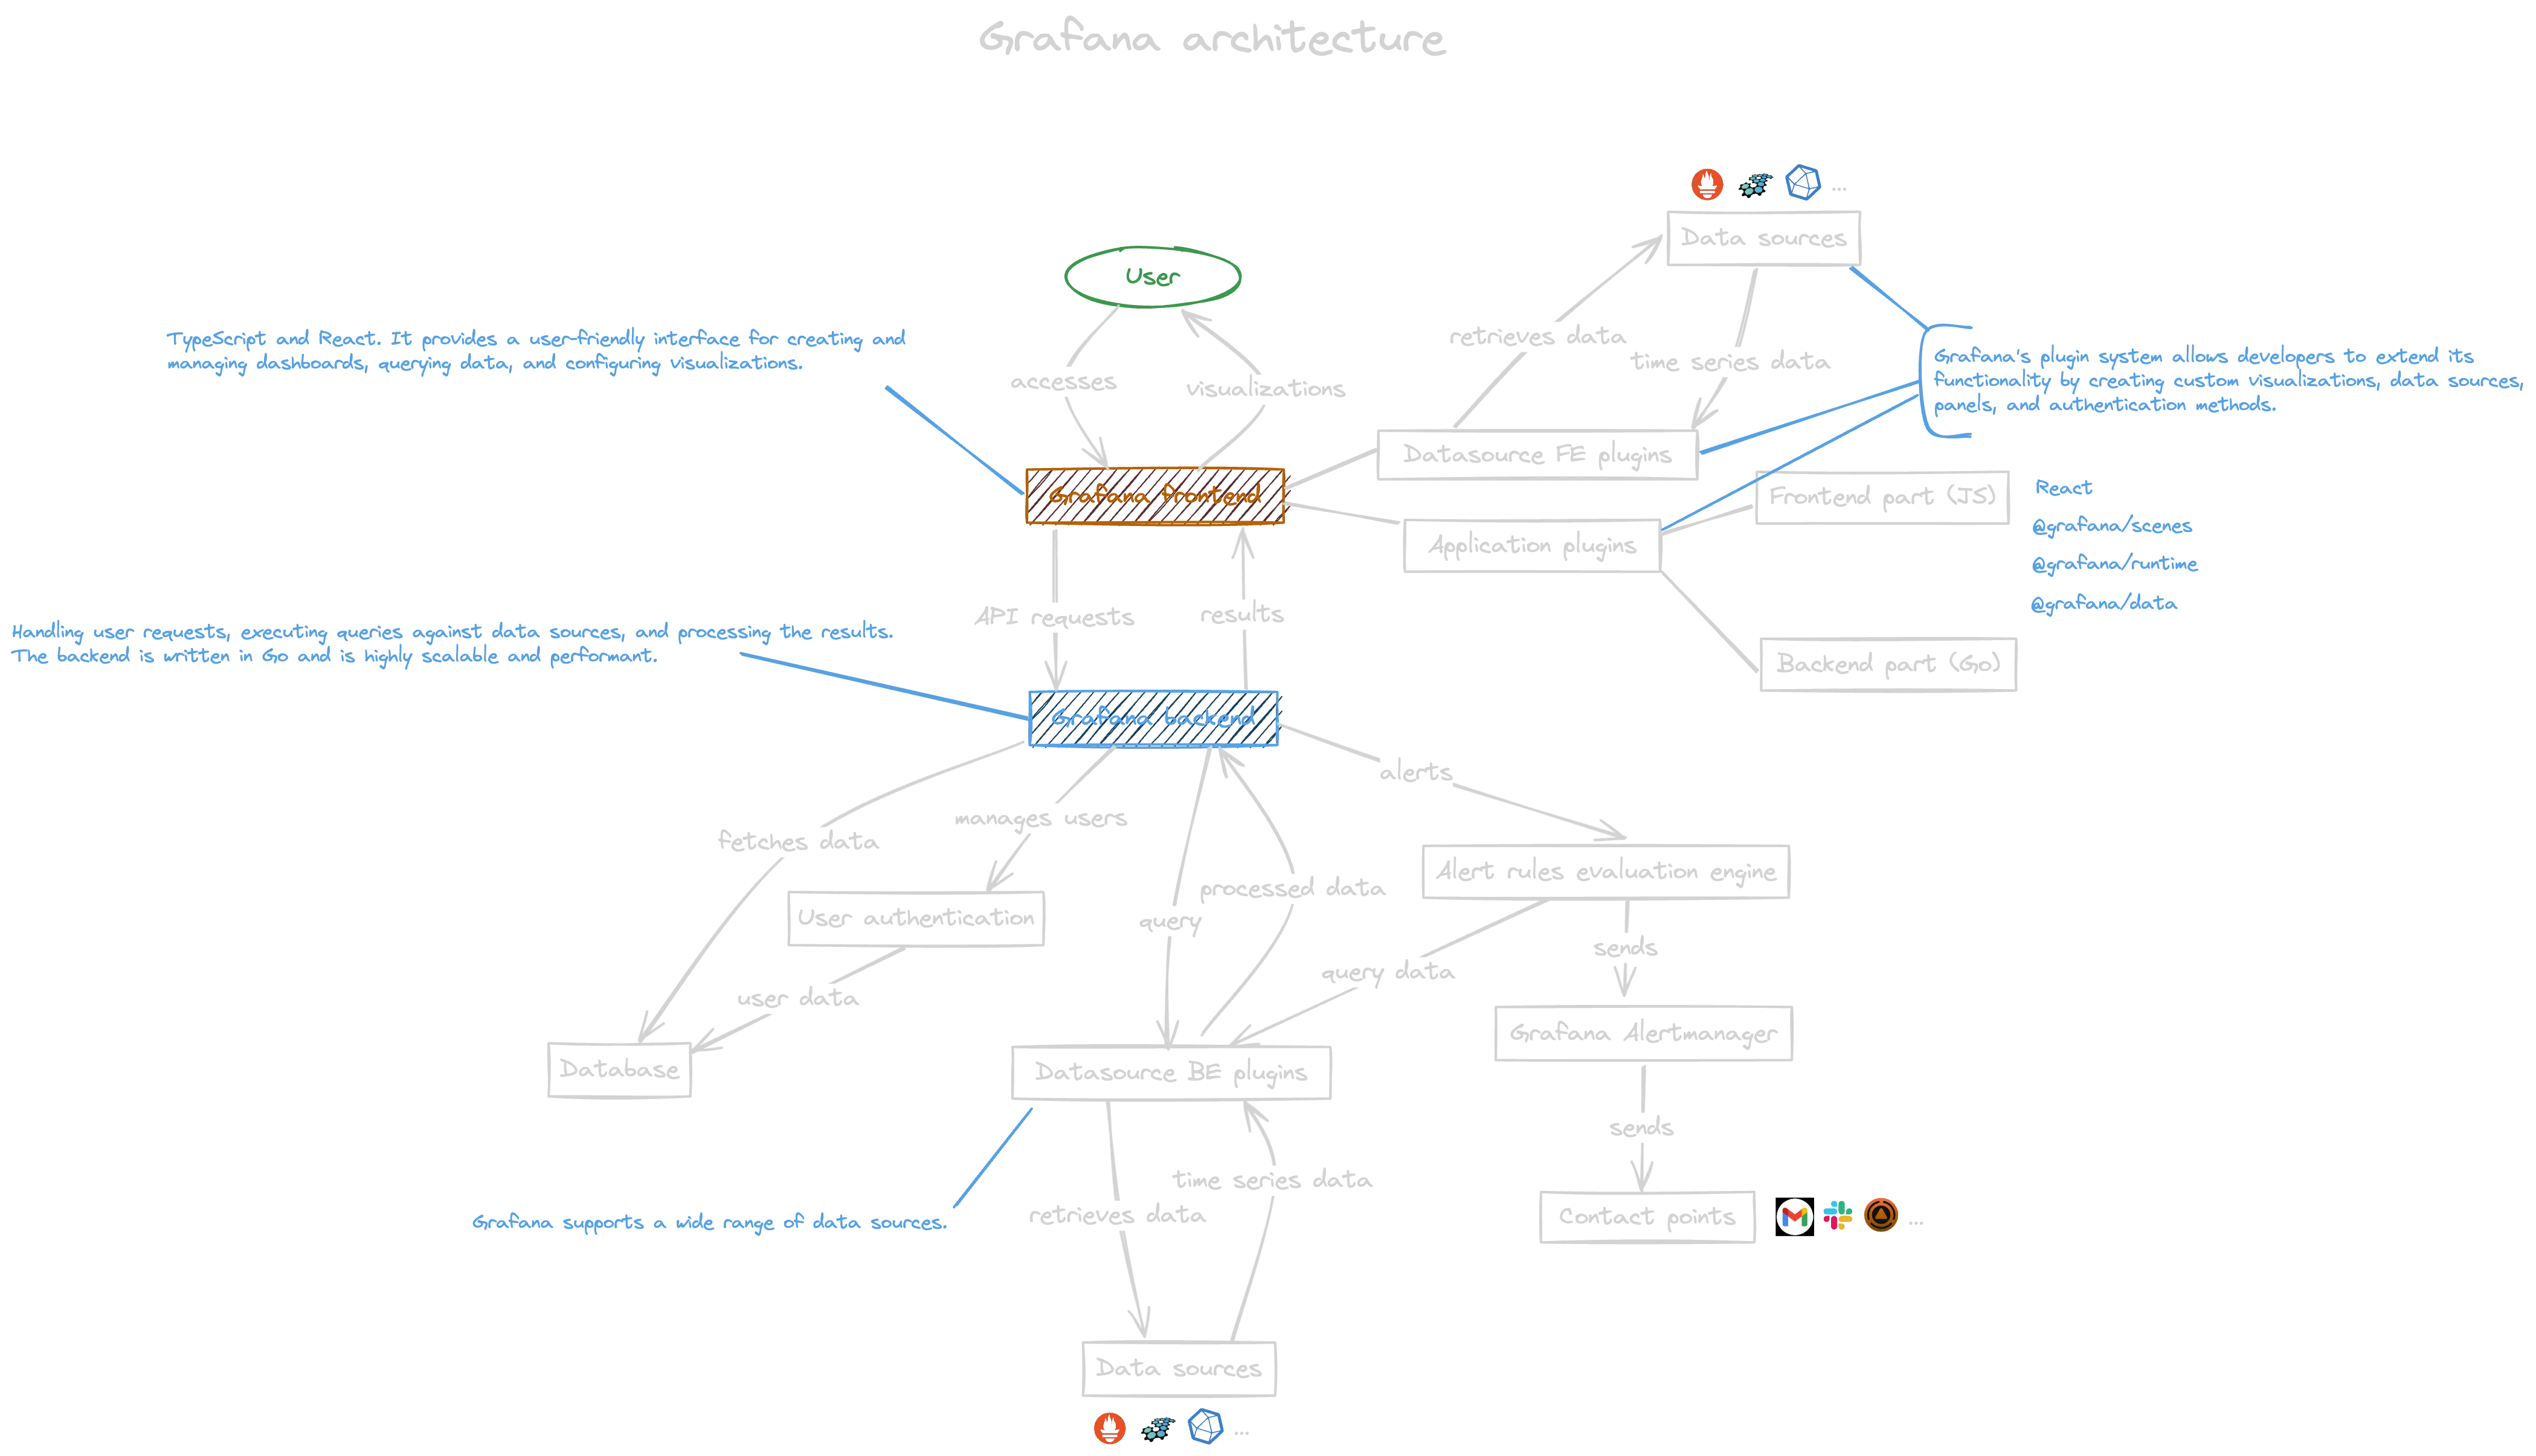
Grafana frontend
Grafana’s frontend is built using TypeScript and React. It provides a user-friendly interface for creating and managing dashboards, querying data, and configuring visualizations.
The frontend communicates with the backend via RESTful APIs to fetch data and perform operations.
Grafana also employs its own framework (@grafana/scenes) for development. Grafana Scenes is a new frontend library that enables developers to create dashboard-like experiences, including querying and transformations, dynamic panel rendering, and time ranges, directly within their Grafana application plugins. Here you can find Core concepts of scenes.
Data source plugins
By installing and configuring datasource plugins, users can connect Grafana to their data sources, create dashboards, and visualize data from multiple sources in a unified interface.
This flexibility makes Grafana a versatile tool for monitoring and observability in various environments.
Even if you have a super custom datasource, you can write a plugin that accepts queries, communicates with your datasource, transforms the retrieved data into a format that Grafana understands, and then presents it for visualization.
Here’s a high-level overview of the process:
-
Develop a datasource plugin: Write a datasource plugin using Grafana’s plugin framework. This involves implementing methods for querying your custom datasource, processing the returned data, and formatting it appropriately for visualization.
-
Define query capabilities: Define the query capabilities of your datasource plugin, specifying the parameters that users can use to query data from your datasource. This could include selecting metrics, specifying time ranges, filtering data, and any other relevant options.
-
Transform data: When your plugin receives a query request, it communicates with your custom datasource, retrieves the requested data, and then transforms it into a format that Grafana understands. This may involve parsing, aggregating, or otherwise manipulating the data to prepare it for visualization.
-
Return data to Grafana: Once the data has been transformed, your plugin returns it to Grafana in the expected format. This typically involves formatting the data as time series data, table data, or another compatible format, depending on the visualization being used.
-
Visualize data: Grafana then uses the returned data to generate visualizations, such as graphs, charts, or tables, which are displayed on the dashboard.
Data source plugins in Grafana can also be backend-based. Backend-based data source plugins handle data retrieval and processing on the server-side, rather than directly within the frontend.
App plugins
App plugins in Grafana are extensions that allow users to add additional functionality and features to their Grafana instance. Unlike data source plugins or panel plugins, which are focused on data visualization and retrieval, app plugins typically provide broader functionality that enhances the overall Grafana experience.
App plugins can add new pages, dashboards, visualizations, or administrative tools to Grafana. They can introduce new workflows, integrations with external services, or custom UI components tailored to specific use cases.
Also app plugin can contain a backend part. The server-side code responsible for handling requests, performing business logic, and interacting with external systems or data sources. This backend code runs on the Grafana server and processes requests initiated by users or other components of the Grafana application.
Grafana backend
Grafana’s backend provides a variety of APIs for interacting with and managing different aspects of the Grafana application such as datasources, plugins, dashboards, users and access.
User management
In Grafana, backend user management refers to the functionality provided by the Grafana server to manage users, roles, permissions, and authentication methods. This functionality allows administrators to control access to Grafana and its resources, as well as manage user accounts and permissions.
Grafana Alerting
The alerting engine in Grafana is a powerful feature that allows users to create and manage alerts based on the data displayed in their dashboards. It enables users to define conditions and thresholds for specific metrics or data points and trigger notifications when those conditions are met.
Grafana doesn’t use Prometheus as its alert generator because Grafana Alerting needs to work with many other data sources in addition to Prometheus. However, it does use Alertmanager as its alert receiver.
However, you can use other Alertmanagers too, and these are referred to as External Alertmanagers.
Grafana Alert rules
In Grafana, there are two types of alert rules: managed alert rules and data source managed alert rules. Here’s a comparison between the two:
-
Grafana Managed Alert Rules:
- These alert rules are managed within Grafana itself, independent of any specific data source.
- Users define alert conditions and thresholds directly in Grafana using the alerting engine.
- Alert rules are evaluated based on data retrieved from one or more data sources configured in Grafana.
- Users can create, manage, and visualize these alert rules within Grafana’s UI.
- Grafana manages the alerting lifecycle, including evaluation, state management, and notification triggering.
-
Data Source Managed Alert Rules:
- These alert rules are managed and evaluated by the data source itself.
- Alert conditions and thresholds are defined and managed within the data source, typically using features provided by the data source.
- Alert rules are evaluated based on data retrieved directly from the data source, without passing through Grafana’s alerting engine.
- Users may configure and manage these alert rules using tools or interfaces provided by the data source, rather than within Grafana.
- The data source is responsible for managing the alerting lifecycle, including evaluation, state management, and notification triggering.
In summary, Grafana managed alert rules are defined and managed within Grafana using its native alerting engine, while data source managed alert rules are defined and managed within the data source itself. The choice between the two depends on factors such as the capabilities of the data source, the desired level of integration with Grafana, and the specific requirements of the alerting use case.